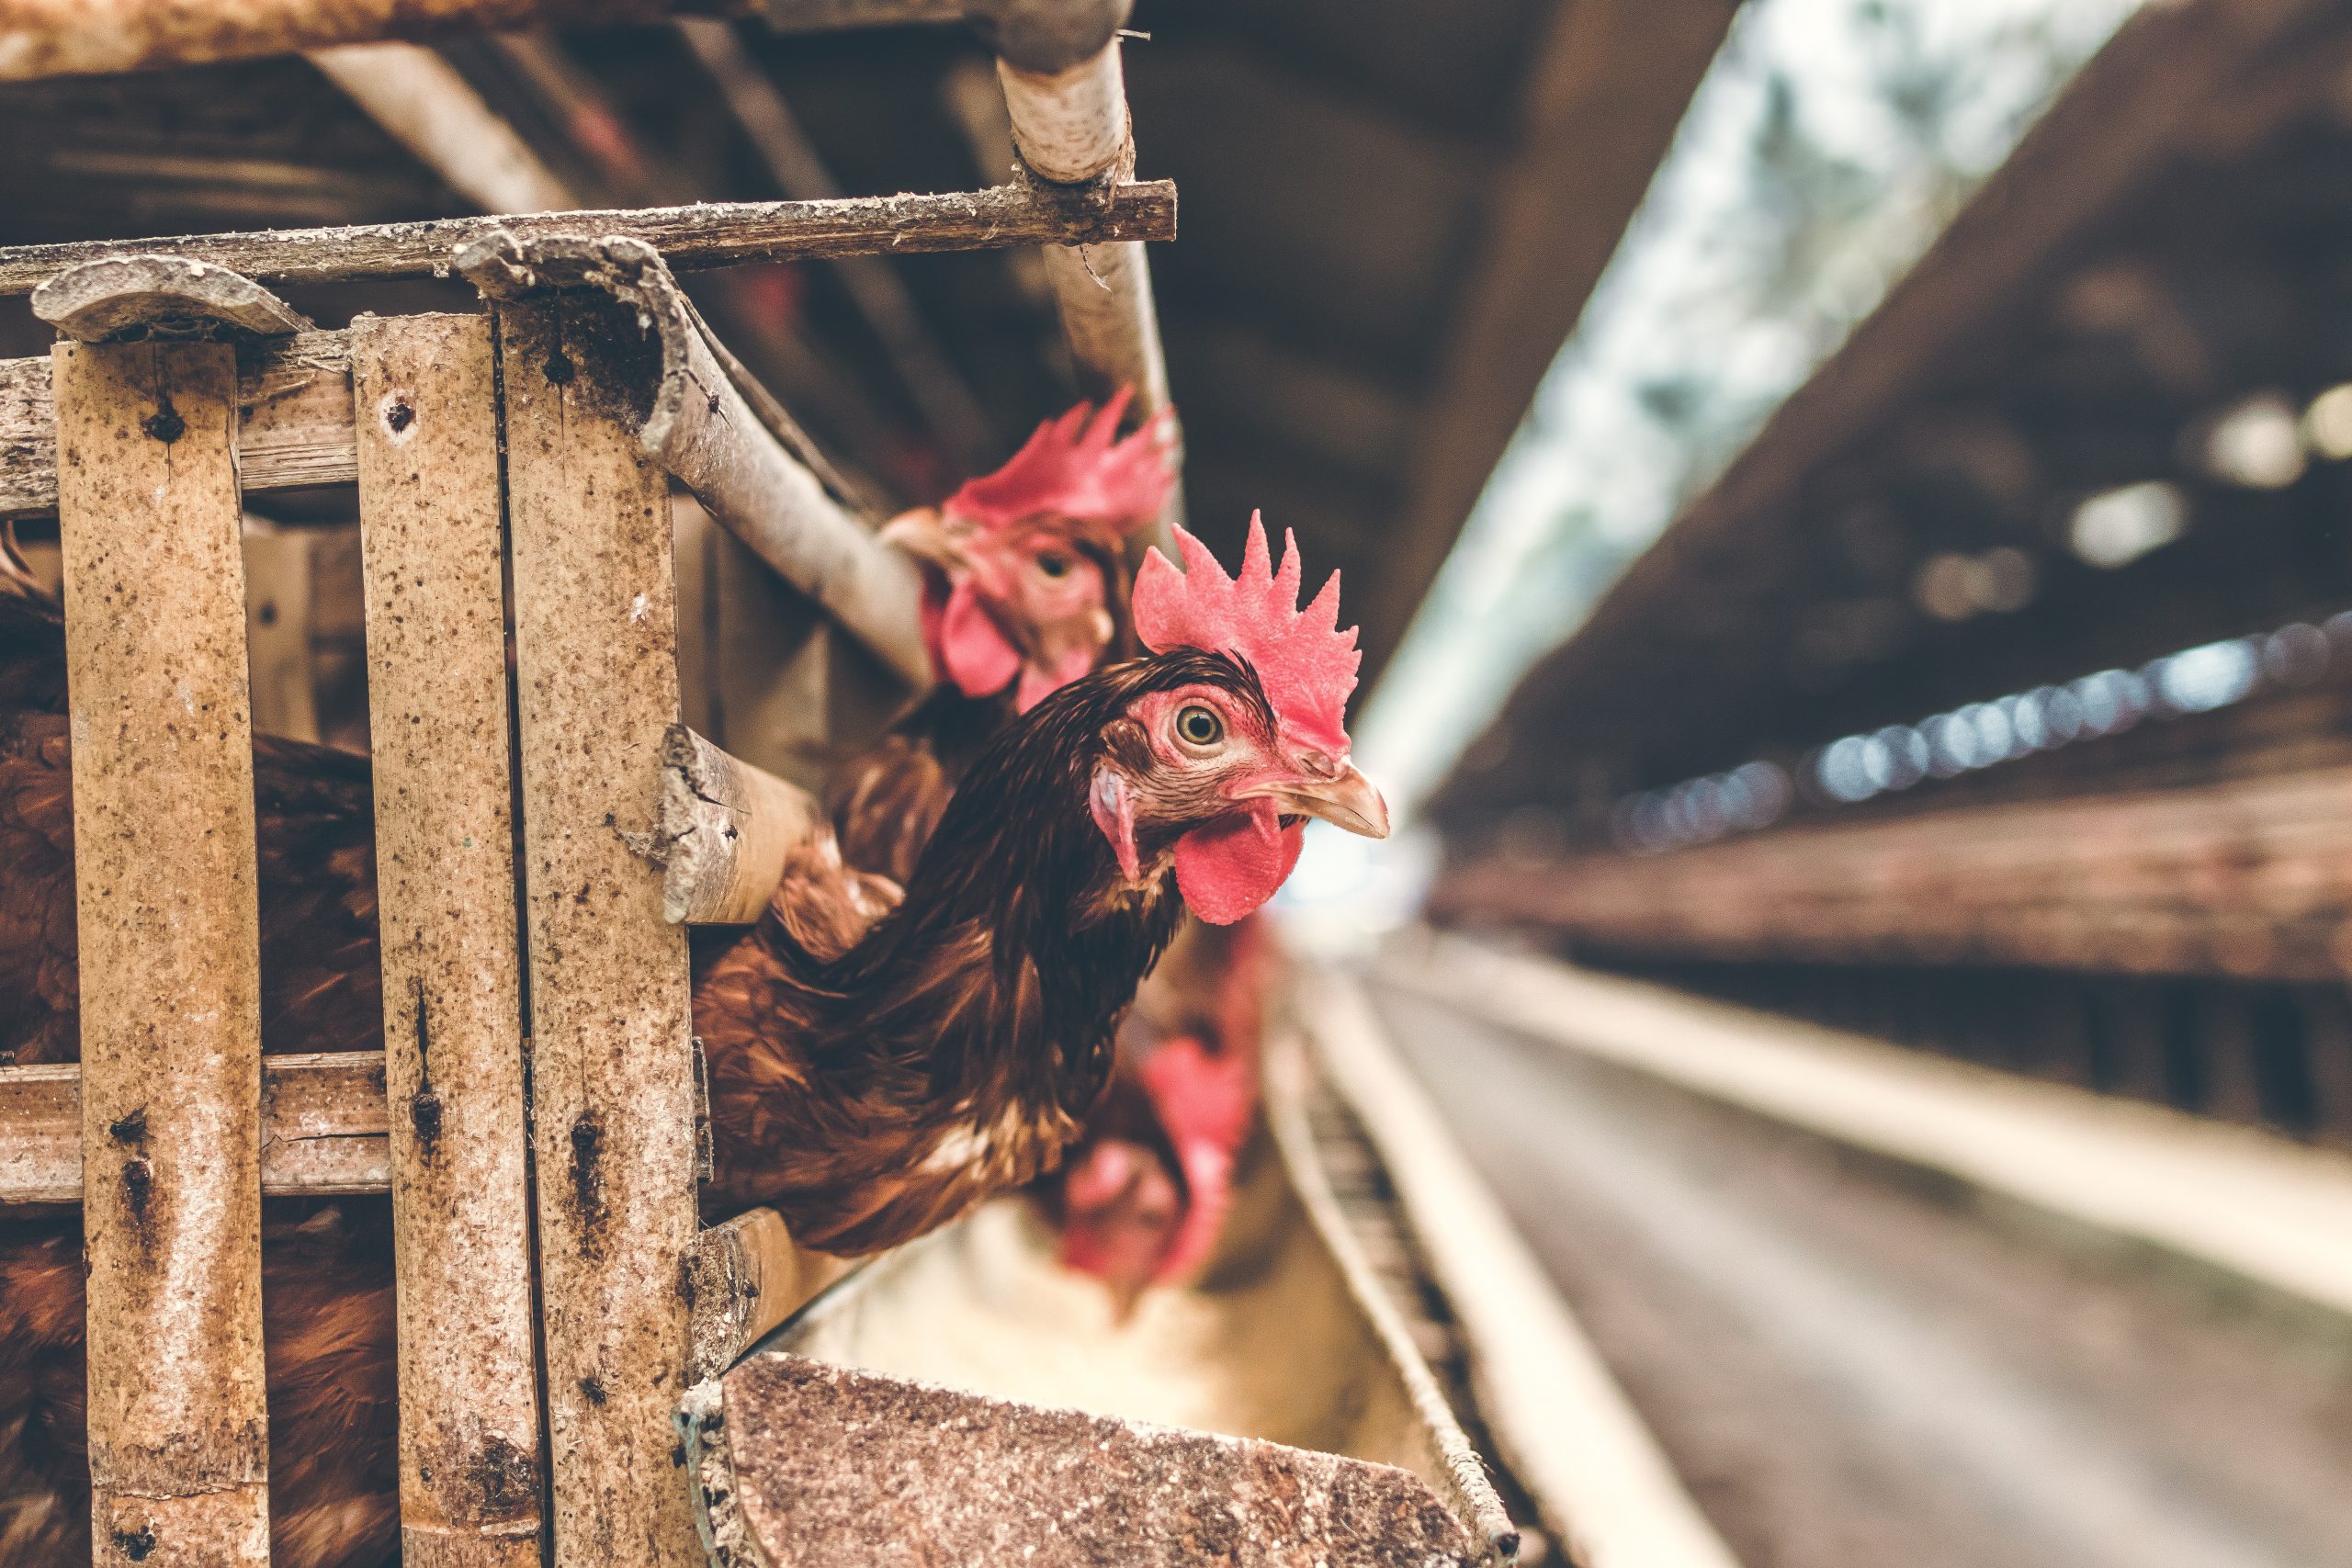
Photo by Artem Beliaikin on Unsplash Production of boiler chickens (those raised for their meat, not eggs) in the US...


Inflation is Coming Down; I Can Feel it in My Bones
According to the Bureau of Labor Statistics, the all items Consumer Price Index (CPI) dropped from 8.2% in September 2022 to 7.7% for the 12 months ending October 2022 – the smallest 12-month increase since the period ending January 2022. Here is a summary of the CPI, the food and energy indexes and the CPI without the food and energy components for the last 4 months of 2022:
| Months | CPI (%) | Food Index (%) | Energy Index (%) | CPI less food & energy (%) |
| July | 8.5 | 10.9 | 32.9 | 5.9 |
| Aug | 8.3 | 11.4 | 23.8 | 6.3 |
| September | 8.2 | 11.2 | 19.8 | 6.6 |
| October | 7.7 | 10.9 | 17.6 | 6.3 |
Everyone has been feeling the pinch especially at the inelastic home items like milk, eggs, flour while seeing the price of gas creeping downwards. Are the prices of consumer goods really coming down anytime soon? According to the International Monetary Fund (IMF) managing director, Kristalina Georgieva, bringing the inflation rates to pre-pandemic level will be challenging:
“We actually think inflation is going to be harder to bring down to the desirable level of around 2%. Why? Because the drivers of deflation are not only supply [and] demand disruption, but also a changing cost structure that comes from the realization that, no more, we make economic decisions only on the basis of cost. Supply chain security also matters. If we are going to see diversification of supply chains, that inevitably is going to put some upward pressure on prices.”
Discussion Questions:
- Looking at the CPI Summary table above, indicate and explain
- TWO takeaways you observe about the direction of the CPI and CPI less food and energy
- The Energy Index has been declining over the last 4 months; Food Index, fell over the last 3 months. Do you predict that this trend will continue or reverse given that the coming months include the holiday and winter season?
- Visit this website: Historical Inflation Rates: 1914-2015.
- Scroll down to the last three rows for the monthly inflation data from January of 2020 up to the latest in 2022 and complete the table below.
- Then state and explain 1 trend for each year that you observe from the table above about the state of the economy with respect to inflation from the beginning of each year to the end of each year for all 3 years?
| Year | Jan | Feb | Mar | Apr | May | Jun | Jul | Aug | Sept | Oct | Nov | Dec |
| 2020 | ||||||||||||
| 2021 | ||||||||||||
| 2022 |
- The IMF managing director commented that to return to 2% inflation rate, the focus needs to shift from a cost perspective to “supply chain security” and “diversification of supply chains”. In economic terminology, will supply chains be considered a factor causing demand-pull inflation or cost-push inflation? Do explain using the Aggregate Demand-Aggregate Supply (AD-AS) model.
- Self-reflection: How will this information change your expenditure plans as a consumer in the coming holiday months when demand for goods and services are expected to rise nationwide? Do explain
Sources| BLS: News Release – Consumer Price Index/Archived Consumer Price Index Supplemental Files; SupplyChainBrian: Global inflation may close to its peak IMF director says; Investopedia: Core Inflation; US Inflation Calculator: Historical Inflation Rates: 1914-2021; The Balance: Causes of Inflation; Jason Welker: Demand and Supply Shocks in the AD-AS Model; Unsplash: Picture of US Money