
Photo by Artem Beliaikin on Unsplash Production of boiler chickens (those raised for their meat, not eggs) in the US...


Understanding the U.S. Labor Market – A January 2023 Snapshot

According to the Federal Reserve Economic Data (FRED) website, April 2020 recorded the highest unemployment rate during the COVID-19 pandemic at 14.8%. As of January 2023, the unemployment rate reduced to 3.4%; returning to lower than the pre-pandemic level of 3.5% as reported for January and February of 2020 at the FRED site.
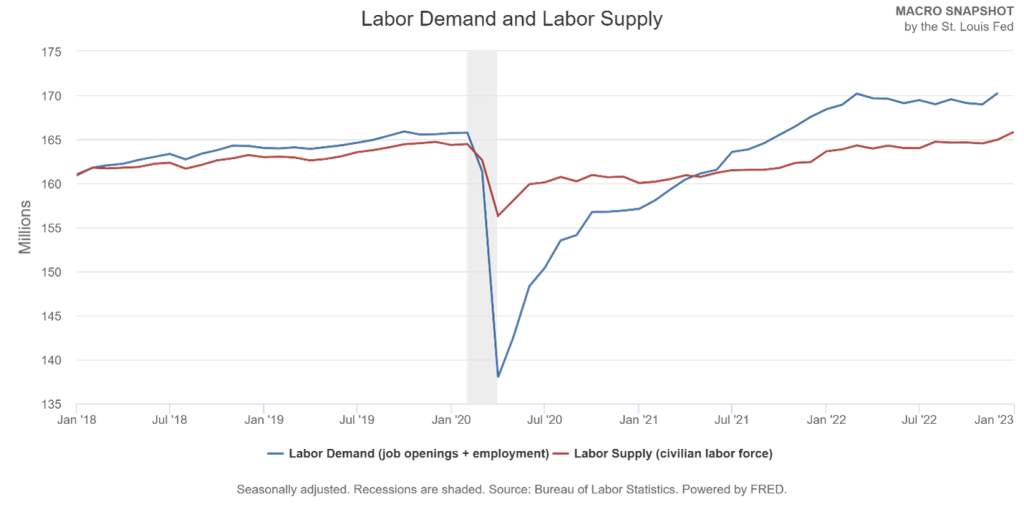
The Bureau of Labor Statistics (BLS) January 2023 news release indicated nonfarm payroll employment increased to 517,000 for the month. Job growth was widespread especially in sectors like leisure and hospitality, professional and business services, and health care. However, the labor-force participation rate, which measures the percentage of working-age adults who are working or looking for work, dipped to 62.4 percent in January relative to the pre-pandemic February 2020 level at 63.3 percent. And labor demand is higher than labor supply, indicating a labor shortage as shown in the graph in the labor market.
Discussion Questions:
- Review the “Labor Demand – Labor Supply” graph below to respond to the subsequent questions:
a) Define “Labor Demand”,
b) Define “Labor Supply”,
c) From the graph above, estimate the month (or months) in 2021, when the “Labor Demand” met the Labor Supply”; what in economics is called the “market equilibrium”,
d) Based on the determinants of demand and supply (click on slides 4 and 5 of the link), explain why there is a shortage of labor around January 2023 since “Labor Demand” from firms is higher than “Labor Supply” from labor,
e) Given that the shaded gray is classified as recession in the graph above,
- explain which type of unemployment (cyclical or natural unemployment) was occurring then?
- Discuss which type of unemployment (cyclical or natural unemployment) is occurring presently around January 2023?
f) Since labor force participation rate is also lower than pre-pandemic level, discuss why U.S. workers are not eager to work.
- Self-reflection: Imagine you are working for BLS or the FED, looking at the graph above, predict/forecast what will happen to the “Labor Demand” and “Labor Supply” curve from January 2023 up to July 2023 (i.e., the next part of the graph above given its six months interval on the horizontal axis):
a) Labor Demand falls, Labor Supply increases – narrow the labor shortage?
b) Labor Demand increases, Labor Supply increases – no change/widen the labor shortage?
c) Labor Demand falls, Labor Supply falls – no change/narrow the labor shortage
d) Labor Demand increases, Labor Supply falls – widen the labor shortage?
Sources| FRED Economic Data: https://fred.stlouisfed.org/series/UNRATE/; US Bureau of Labor Statistics: https://www.bls.gov/news.release/pdf/empsit.pdf; The Balance: https://www.thebalance.com/labor-force-participation-rate-formula-and-examples-3305805; FRED: https://stlouisfed.shinyapps.io/macro-snapshot/#labor; FED of St. Louis: https://www.stlouisfed.org/education/economic-lowdown-video-series/episode-4-the-labor-market; SlidePlayer: https://slideplayer.com/slide/16427402/; FED of St. Louis: https://www.stlouisfed.org/education/economic-lowdown-video-series/episode-10-unemployment; Unsplash: https://unsplash.com/photos/Pd4lRfKo16U