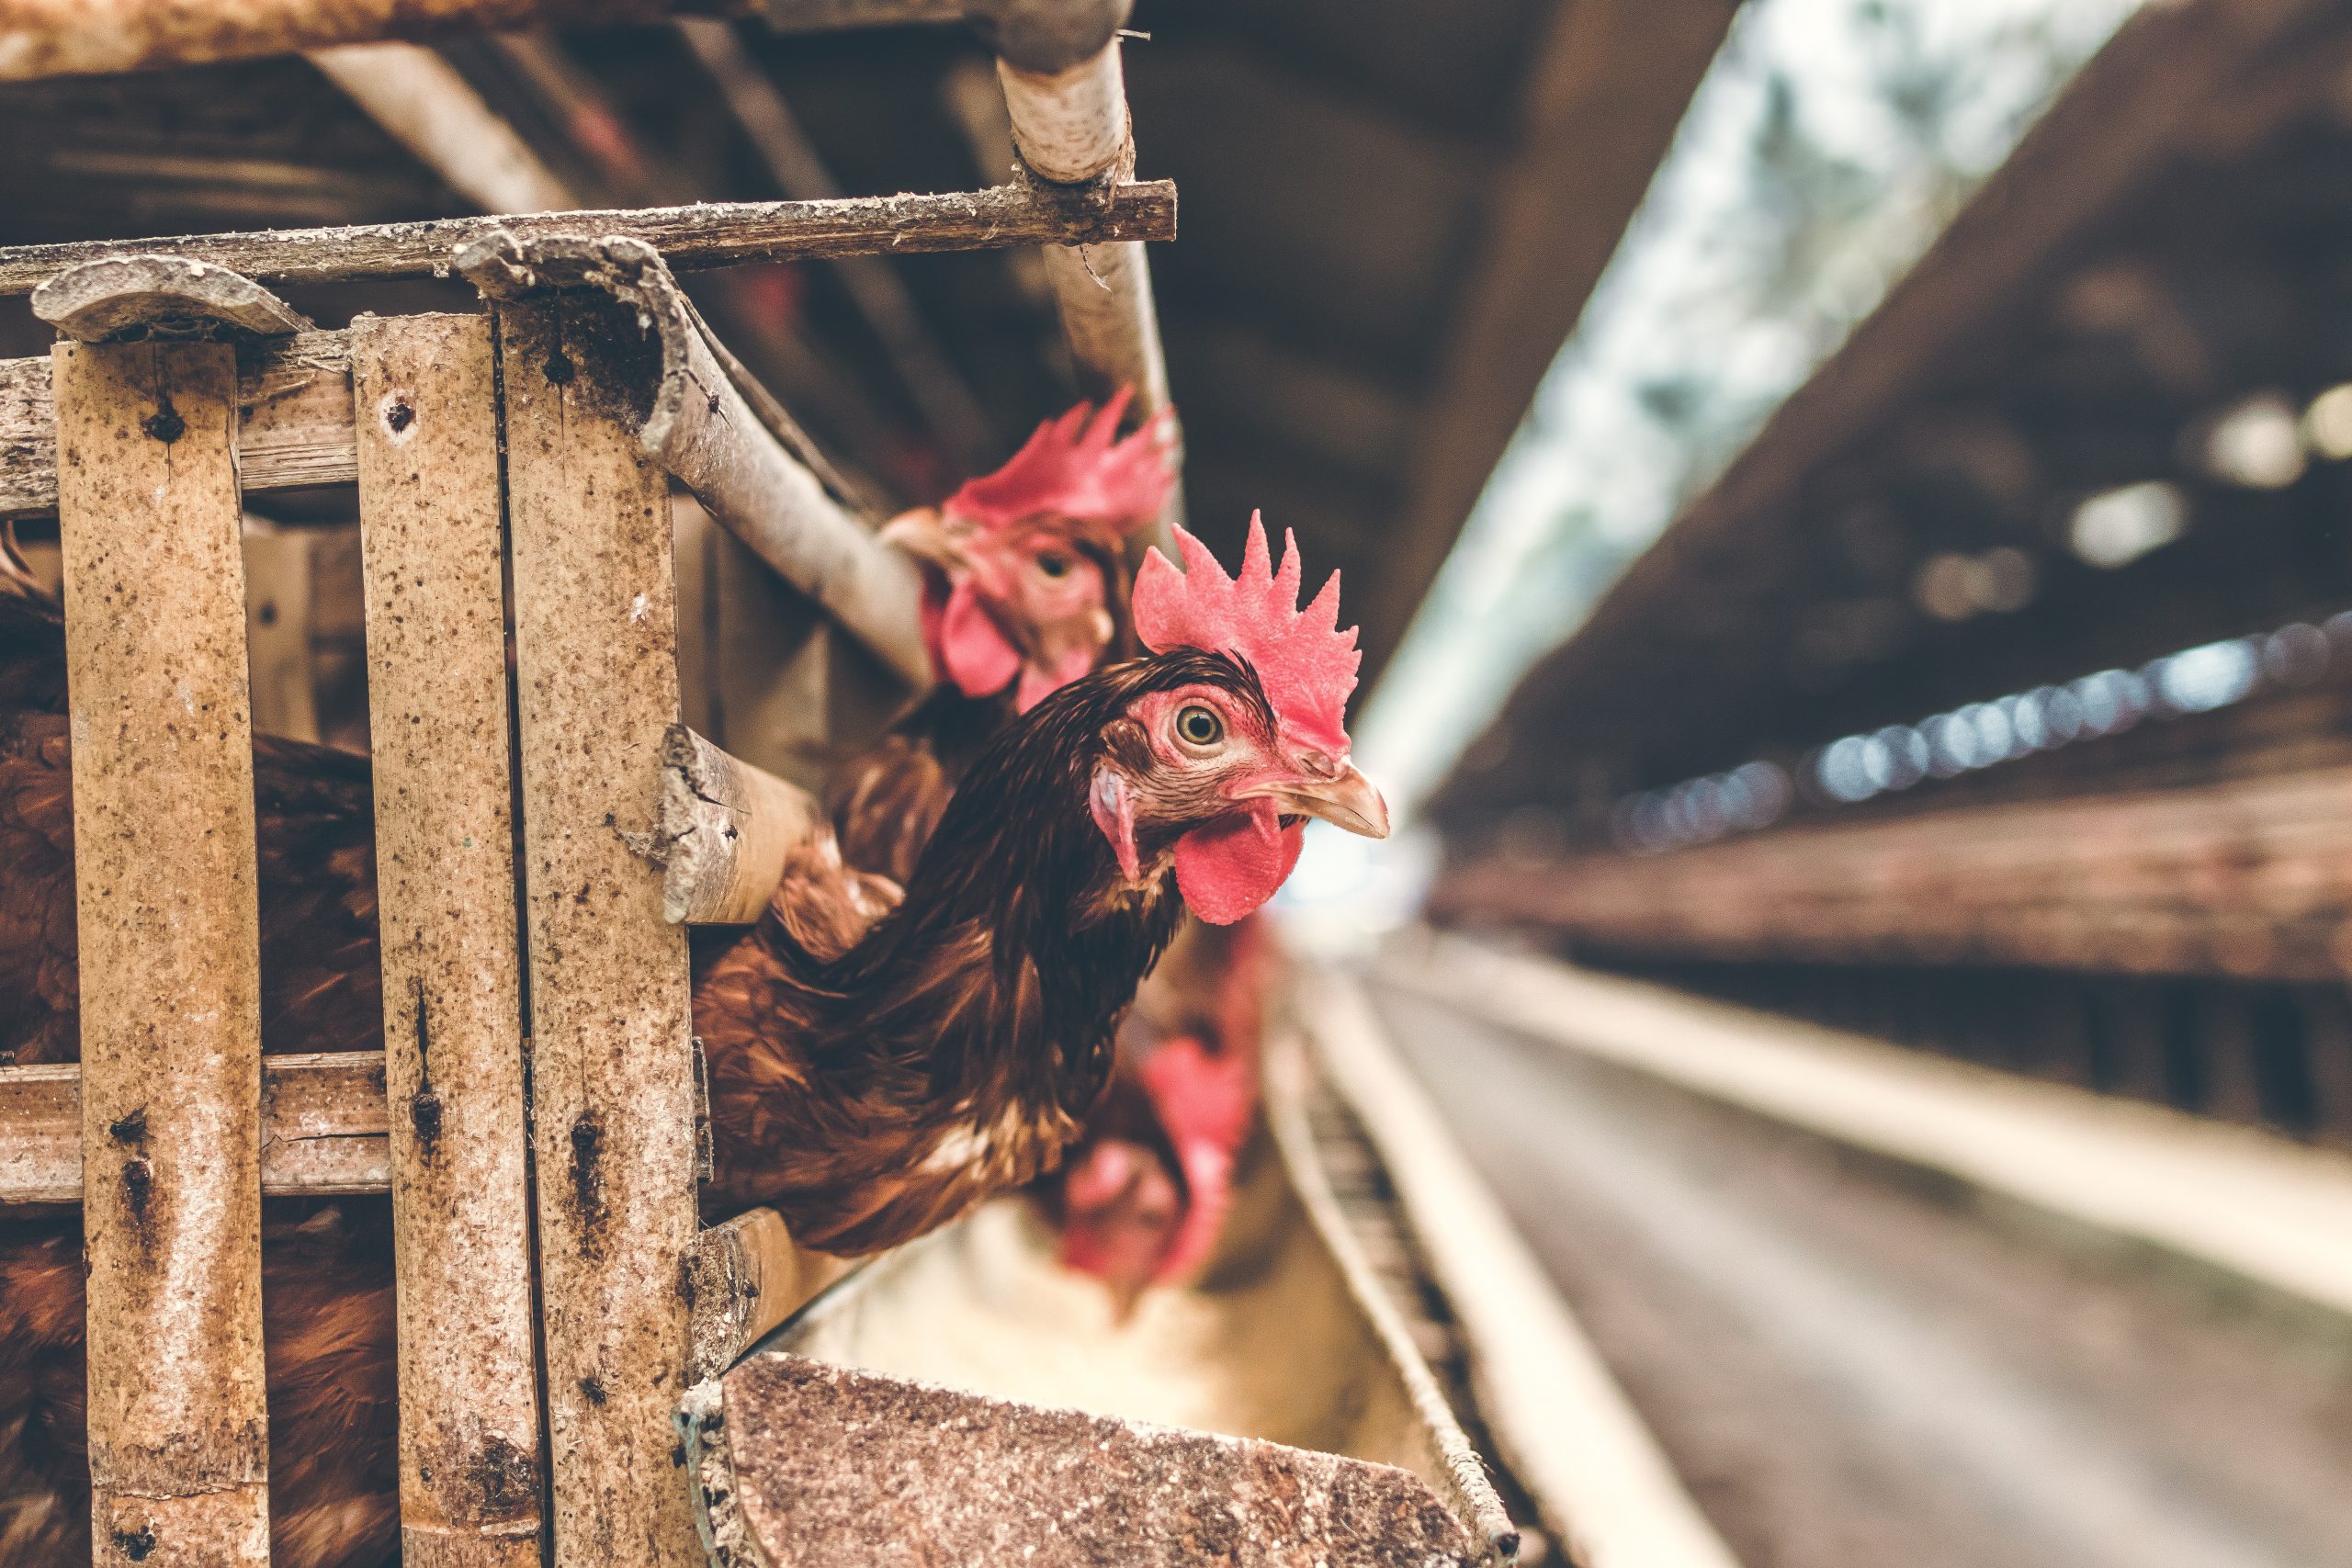
Photo by Artem Beliaikin on Unsplash Production of boiler chickens (those raised for their meat, not eggs) in the US...


Consumer Price Index vs. Financial Literacy – What Do They Have in Common?
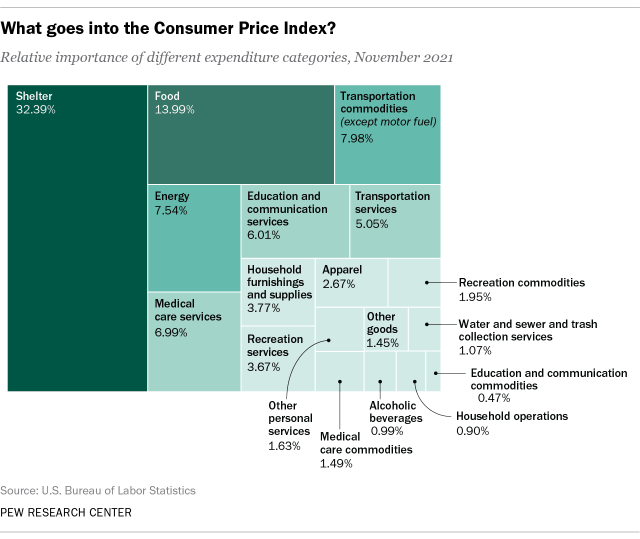
April is financial literacy month! On Wednesday, April 6th 2022, CNBC held a virtual session with 3 governors from Mississippi, New Jersey, and Nevada about the need for financial literacy in schools. Families need a sound financial foundation to better manage their money and spending habits given the current economic anxiety – rising inflation and recessionary fears – from the pandemic and tension between Ukraine and Russia. At the national level, the consumption spending patterns are captured by the Bureau of Labor Statistics via the Consumer Price Index (CPI). CPI is a measure of the average change over time in the prices paid by urban consumers for a market basket of consumer goods and services. Below is a visual snapshot of the different expenditure categories in this market basket for November 2021:
Discussion Questions:
- Construct your own personal budget over the last month. Add the total amount spend and then calculate the percentage of each category over the total expenditure. Do include at least the following eight categories:
| Categories | ($) Spent | % Of Total Expenditure |
| Housing | ||
| Food & Beverages | ||
| Transportation | ||
| Apparel | ||
| Medical Care | ||
| Recreation | ||
| Education & Communication | ||
| Other goods & services | ||
| Total Expenditure |
- Compare your personal budget with the November 2021 CPI Market Basket visual provided by Pew Research Center. What discrepancies and/or similarities do you see with your own household basket. Describe/explain why it is so.
- What do you think about the nation’s expenditure pattern via this CPI index? Is it reflective of an individual (in this case, your own) net worth now?
- Are you anticipating any change in income and/or expenses that could affect your household basket in say the next 5 years? How about 10 years?
- Have you factored in unanticipated/emergency measures in your household basket?
- Based on the Circular Flow Model, how will government actions (like increasing the income tax or sales tax or providing subsidies/stimulus checks) affect your household basket in the coming years? Explain.
- Self-reflection: How will this information change your consumption expenditure plans as a consumer in the coming months? Will this activity help you in developing a personal/household budget? How? Do explain.
Sources| CNBC: State governors weigh in on the financial literacy crisis in America and how to solve it in the classroom; BLS: Consumer Price Index; Pew Research Center: As inflation soars, a look at what’s inside the Consumer Price Index; FRED, St. Louis: Circular Flow Model; CPI: Consumer Price Index; Photo by Konstantin Evdokimov on Unsplash